

Comprehensive composition assignment of complex mixture mass spectra
Sierra Analytics’ Investigator software is a game changer for analysis of complex mixtures by mass spectrometry. Years of development have resulted in an application unlike anything else available.
Direct data import
Investigator works best on MS data with high resolution and mass accuracy from QTOF, Orbitrap, or FT-ICR class instruments. It can read raw data directly from most MS vendor formats, including Agilent MassHunter, Bruker XMASS and Compass, JEOL FastFlight, Sciex Analyst, Shimadzu MALDI and LC/MS, Thermo Xcalibur, Waters MassLynx, and more.
Blazing fast processing
Investigator can assign both single-scan and chromatographically-resolved multiple scan data sets using either a co-added range of scans or scan-by-scan while preserving retention time information in the results.
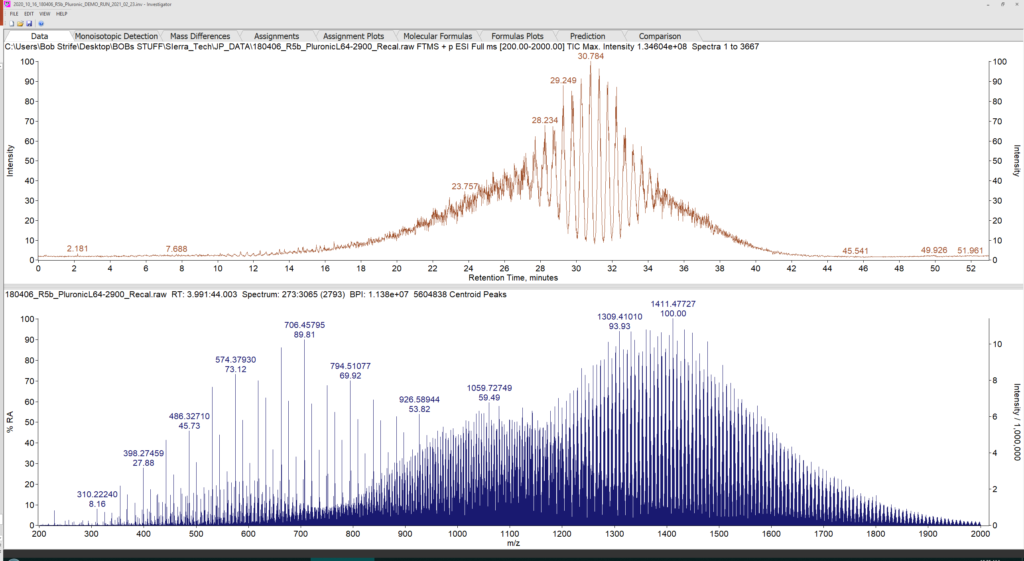
Data reduction and assignment is lightning fast, even when thousands to millions of isotope clusters must be detected, processed, and assigned in a data set. A complete assignment can be performed in less than a second for single scans and in minutes or less for large chromatographic data sets.
| 2500 spectra summed (200-2000 Da) | t = 0.25 min |
| 5.02 x 10^6 mass peaks detected with 39,680 isotope clusters evaluated | t = 1.17 min |
| 30 mass differences found and assigned from > 2 million mass pairs | t = 1.47 min |
| 903 molecular formulae assigned after evaluating 3.8 million candidates | t = 1.87 min |
| Tables and graphics generated | t = 1.90 min |
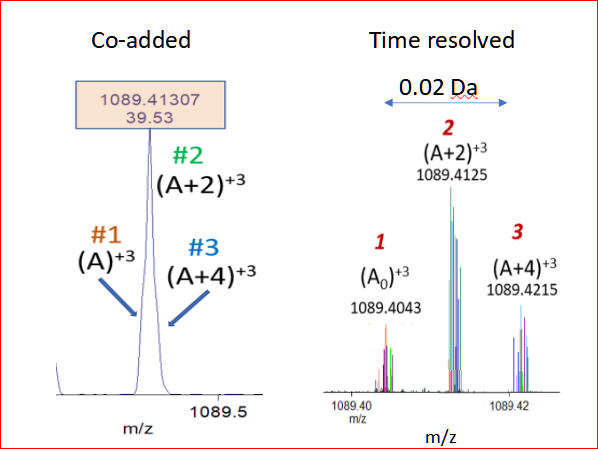
The software automatically identifies and assigns multiply-charged isotope clusters with single or mixed adducts and reduces them to monoisotopic features for assignment. Each resulting elemental composition is interactively linked to all of the spectral features which contribute to that result. For multiple scan data, reconstructed chromatograms can be created from any combination of results.
Interactive 2D and 3D data and results visualization
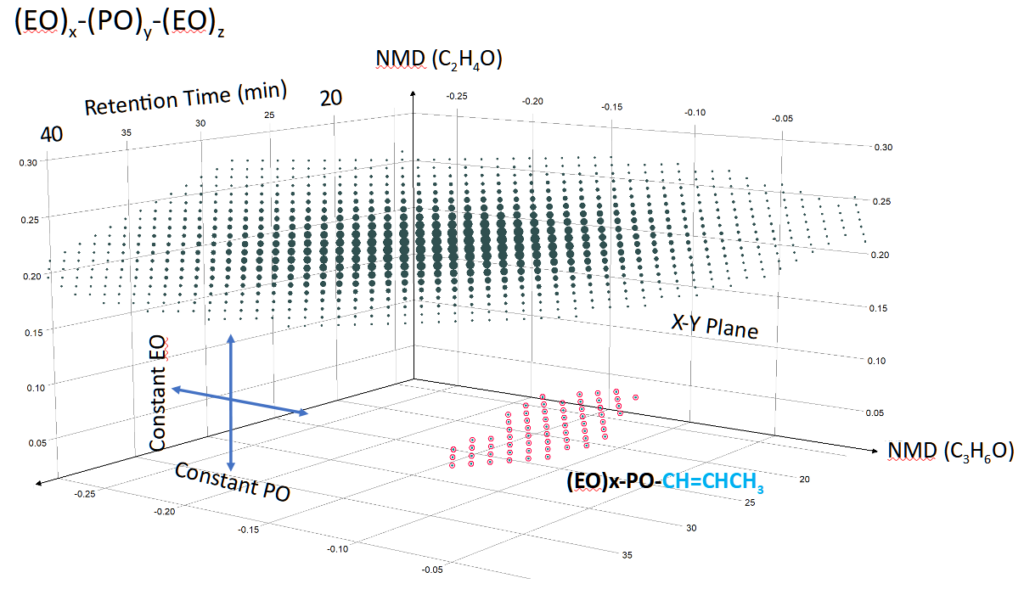
Investigator’s most powerful feature is the ability to create interactive 2- and 3-dimensional dot plots of composition results. Coordinates for each axis can be chosen from inherent or computed values for each assignment to yield plots that can be interactively rotated and scaled to best reveal relationships among results or discover compositions for minor components which would otherwise be hidden in complex spectra.
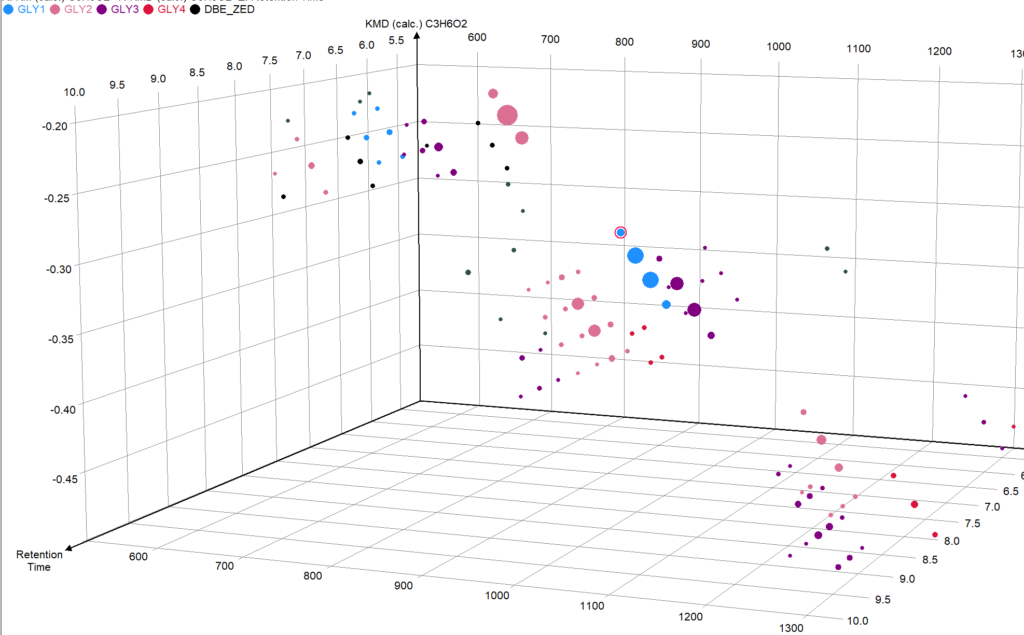
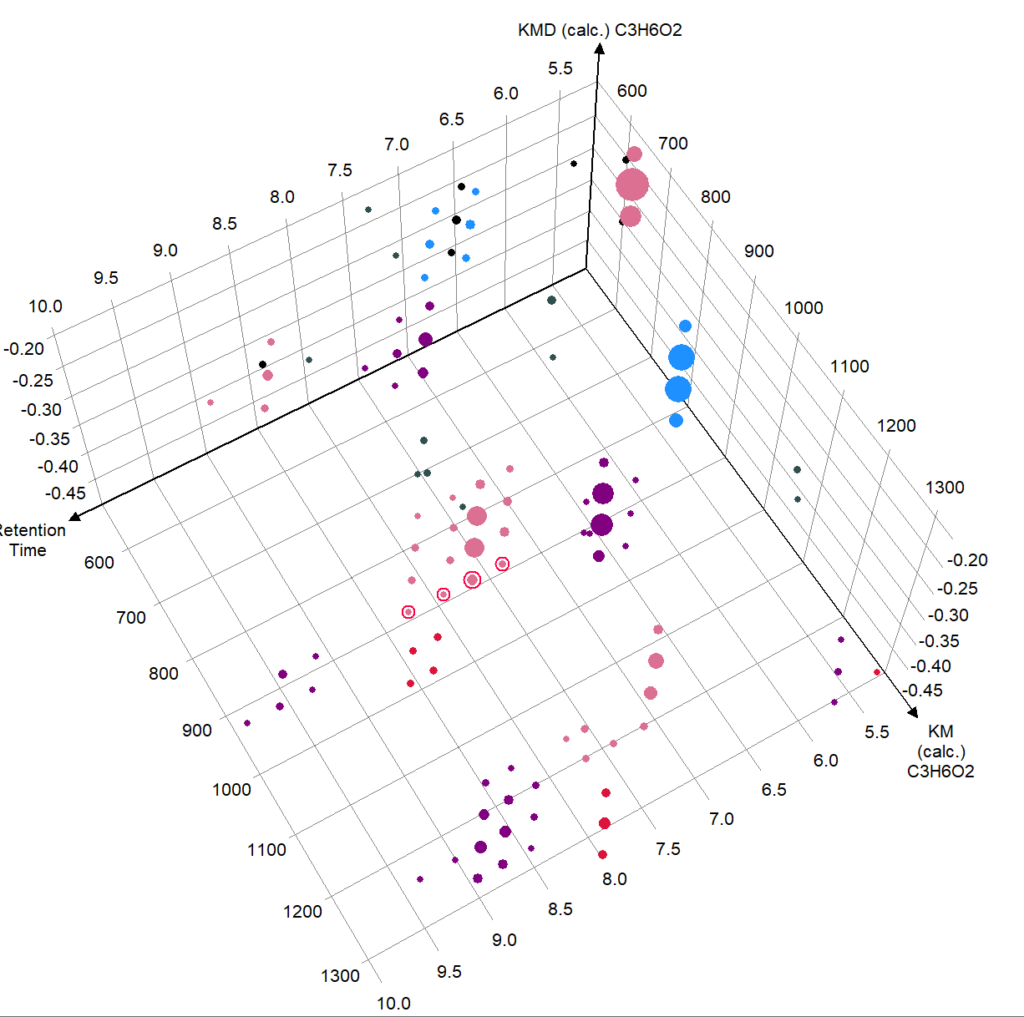
There is complete interactivity between plots and tables of results; a result selected in either a table or plot is simultaneously selected and highlighted everywhere. A versatile lasso tool allows selection of arbitrarily-shaped collections of dots from both 2D and 3D plots.
Any table of results can be exported to a CSV file for further processing. Plots can be exported as high resolution images for insertion in reports and publications. In addition, the entire package of intermediate and final results can be saved as a multi-page Excel workbook.